


追踪视图
Vitest 浏览器模式支持生成 Playwright 的 追踪文件。要启用追踪功能,需要在 test.browser 配置中设置 trace 选项。
WARNING
生成追踪文件仅在使用 Playwright provider 时可用。
import { defineConfig } from 'vitest/config'
import { playwright } from '@vitest/browser-playwright'

export default defineConfig({
  test: {
    browser: {
      provider: playwright(),
      trace: 'on',
    },
  },
})vitest --browser.trace=on默认情况下,Vitest 会为每个测试生成一个追踪文件。你也可以通过设置 trace 为 'on-first-retry'、'on-all-retries' 或 'retain-on-failure' 来配置仅在测试失败时生成追踪。这些文件将保存在测试文件相邻的 __traces__ 文件夹中。追踪文件的名称包括项目名称、测试名称、the repeats 次数和 retry 次数:
chromium-my-test-0-0.trace.zip
^^^^^^^^ 项目名称
         ^^^^^^ 测试名称
                ^ 重复次数
                  ^ 重试次数
要更改输出目录,可以在 test.browser.trace 配置中设置 tracesDir 选项。这样所有追踪文件将按测试文件分组存储在同一目录中。
import { defineConfig } from 'vitest/config'
import { playwright } from '@vitest/browser-playwright'

export default defineConfig({
  test: {
    browser: {
      provider: playwright(),
      trace: {
        mode: 'on',
        // 路径相对于项目根目录
        tracesDir: './playwright-traces',
      },
    },
  },
})
追踪文件在报告器中作为 注释 形式呈现。例如,在 HTML 报告器中,你可以在测试详情页中找到追踪文件的链接。
Trace markers
You can add explicit named markers to make the trace timeline easier to read:
import { page } from 'vitest/browser'

document.body.innerHTML = `
  <button type="button">Sign in</button>
`

await page.getByRole('button', { name: 'Sign in' }).mark('sign in button rendered')
Both page.mark(name) and locator.mark(name) are available.
You can also group multiple operations under one marker with page.mark(name, callback):
await page.mark('sign in flow', async () => {
  await page.getByRole('textbox', { name: 'Email' }).fill('john@example.com')
  await page.getByRole('textbox', { name: 'Password' }).fill('secret')
  await page.getByRole('button', { name: 'Sign in' }).click()
})
You can also wrap reusable helpers with vi.defineHelper() so trace entries point to where the helper is called, not its internals:
import { vi } from 'vitest'
import { page } from 'vitest/browser'

const myRender = vi.defineHelper(async (content: string) => {
  document.body.innerHTML = content
  await page.elementLocator(document.body).mark('render helper')
})

test('renders content', async () => {
  await myRender('<button>Hello</button>') // trace points to this line
})
预览
要打开追踪文件,可以使用 Playwright Trace Viewer。在终端中运行以下命令:
npx playwright show-trace "path-to-trace-file"这将启动 Trace Viewer 并加载指定的追踪文件。
或者,你可以在浏览器中打开 https://trace.playwright.dev 并在那里上传追踪文件。
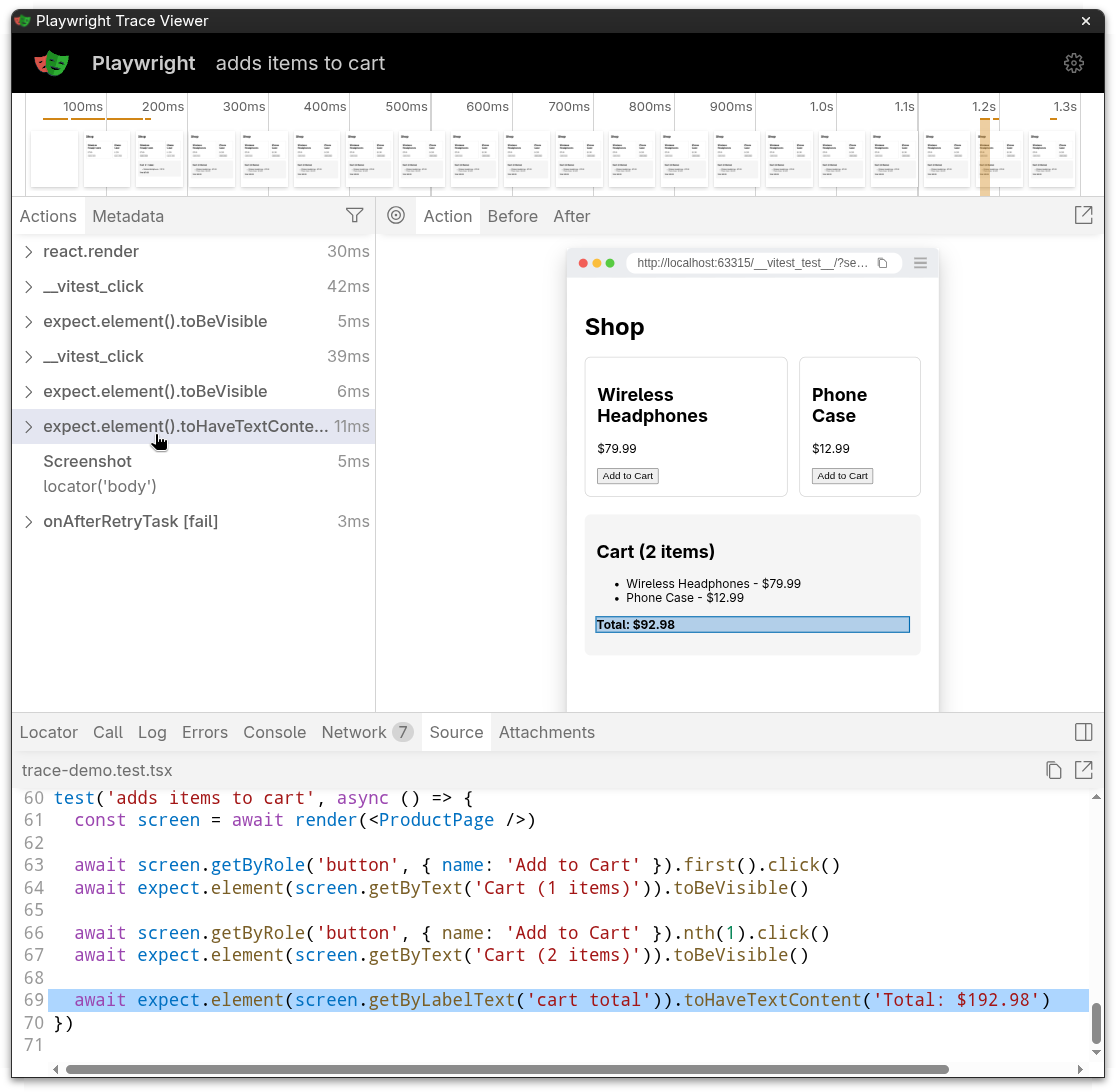
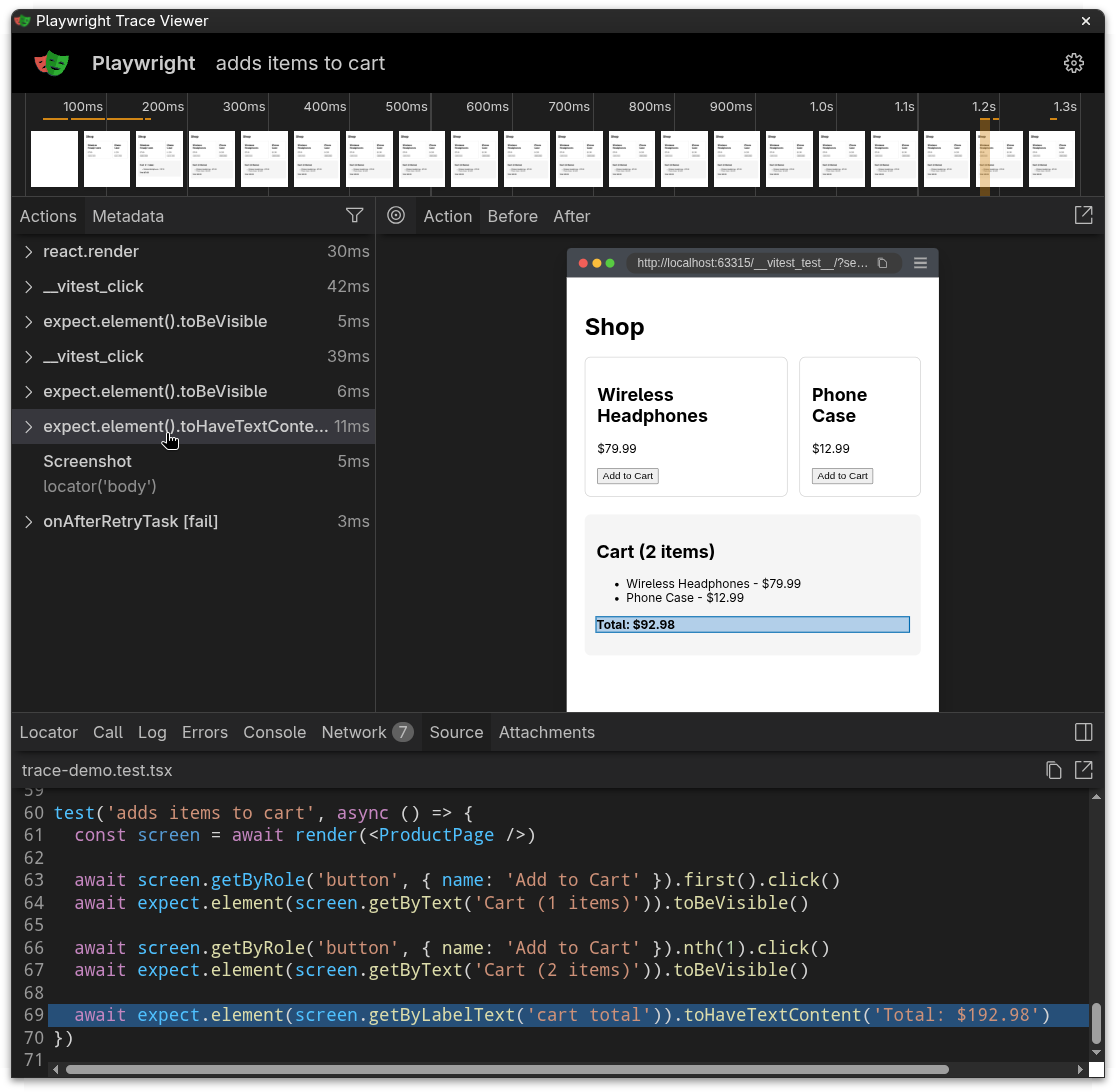
局限性
目前,Vitest 无法填充 Trace Viewer 中的 "Sources" 标签页。这意味着虽然你可以看到测试期间捕获的操作和截图,但无法直接在 Trace Viewer 中查看测试的源代码。你需要返回代码编辑器查看测试实现。
expect.element(...)assertions- Interactive actions like
click,fill,type,hover,selectOptions,upload,dragAndDrop,tab,keyboard,wheel, and screenshots
Under the hood, Playwright still records its own low-level action events as usual. Vitest wraps them with source-location groups so you can jump straight from the trace timeline to the relevant line in your test.
Keep in mind that plain assertions like expect(value).toBe(...) run in Node, not the browser, so they won't show up in the trace.
For anything not covered automatically, you can use page.mark() or locator.mark() to add your own trace groups — see Trace markers above.
WARNING
Currently a source view of a trace can be only displayed properly when viewing it on the machine generated a trace with playwright show-trace CLI. This is expected to be fixed soon (see https://github.com/microsoft/playwright/pull/39307).